
Working with object detection in deep learning can sometimes be difficult but it is extremely fun. And it feels even more rewarding when we are able to solve the detection problem on our custom dataset. But when working with a custom dataset, how do we know that our object detection algorithm has reached its optimal performance? How do we know that going through a few more epochs won’t lead to the overfitting of the deep learning algorithm? In fact, these questions are really important when working with competitive datasets like PASCAL VOC or MS COCO dataset as well. These competition datasets have pretty stringent object detection evaluation metrics. And these mostly revolve around Average Precision (AP), Recall, and mean-Average Precision (mAP).
In this article, we will learn about the evaluation metrics that are commonly used in object detection. Before moving deep into any object detection project, it is better to have a grasp of these concepts.
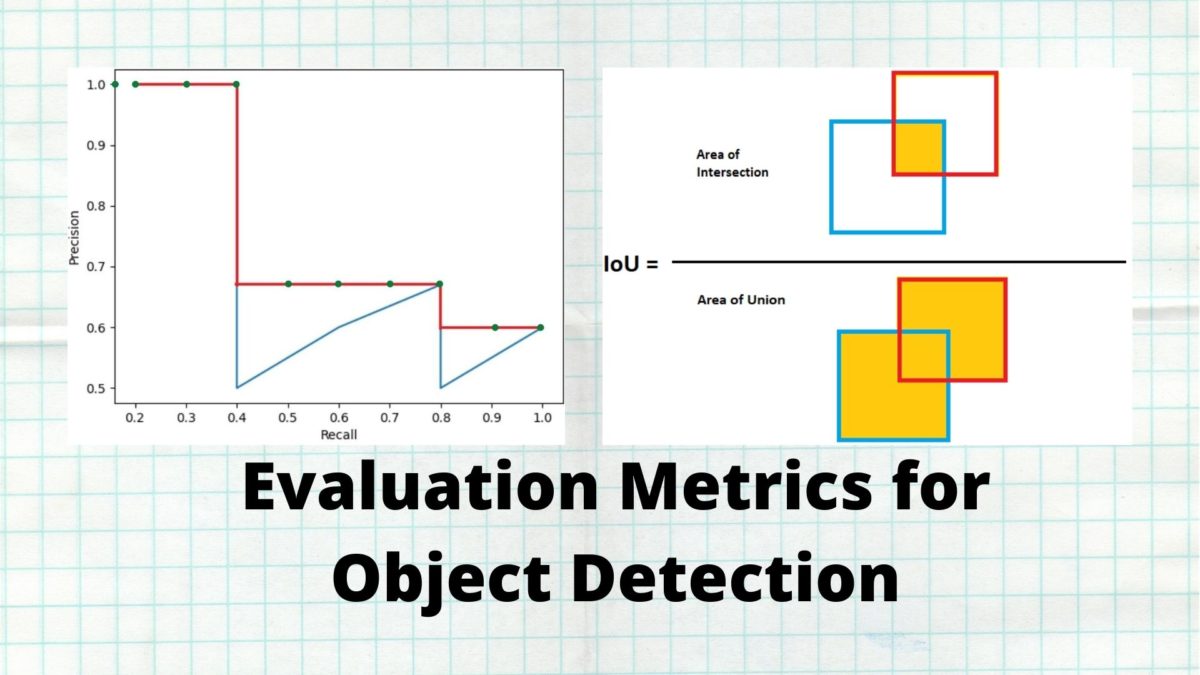
What will you learn from this article?
- The different evaluation metrics for deep learning object detection.
- What is Average Precision?
- What is IoU (Intersection over Union)?
- mAP (mean Average Precision) evaluation metric.
I hope that after going through this article you will have a clear understanding of different evaluation metrics for object detection.
Before moving further, you can also check my Introduction to Deep Learning for Object Detection post here. It will help you understand some simple concepts about object detection and also introduce you to some of the best results in deep learning and object detection.
The Role of Precision and Recall
Before moving into the depths of Average Precision, IoU, and mAP we need some basic concepts that are really important. Although I am pretty sure that you know about precision and recall, still let’s have a short glance over these concepts. This will also make our work of understanding the detection metrics much easier.
Precision in Machine Learning
Precision is not a deep learning or object detection concept. It is a simple machine learning concept. Now, what is precision?
Precision: It tells us, out of all the predictions that our model says are positive, how many are actually positive? Or, What proportions of all the positive predictions are actually positive?
$$
Precision\ =\ \frac{TP}{TP+FP}
$$
In the above formula, TP is True Positive, and FP is False Positive.
Recall: Out of all the positive cases, how many positive cases does the model identify?
$$
Recall\ =\ \frac{TP}{TP + FN}
$$
In the above formula, FN is False Negative.
If you are still a bit confused, the following example will help.
Suppose that we have a bunch of images. We have to identity whether the image is of a dog (positive case) or not. Then
$$
Precision = \frac{TP}{total\ positive\ results\ by\ the\ model}
$$
and
$$
Recall = \frac{TP}{total\ number\ of\ dog\ images}
$$
I hope that the above example makes things clear.
Now that we know about precision and recall, there is just one more concept that we need to know before moving into average precision. That is intersection over union (IoU).
Intersection Over Union
In object detection, we have to predict the bounding boxes around images. After we predict the coordinates of the bounding box, how do we know how much accurate they are?
IoU helps in this case. IoU gives the overlap between two bounding boxes. In object detection, it gives the overlap between the ground truth bounding box and the predicted bounding box.
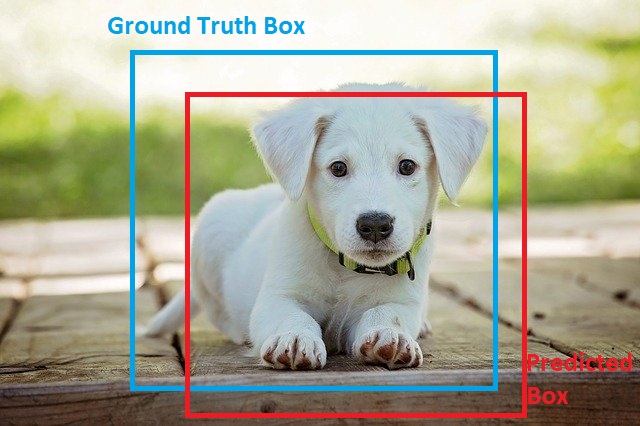
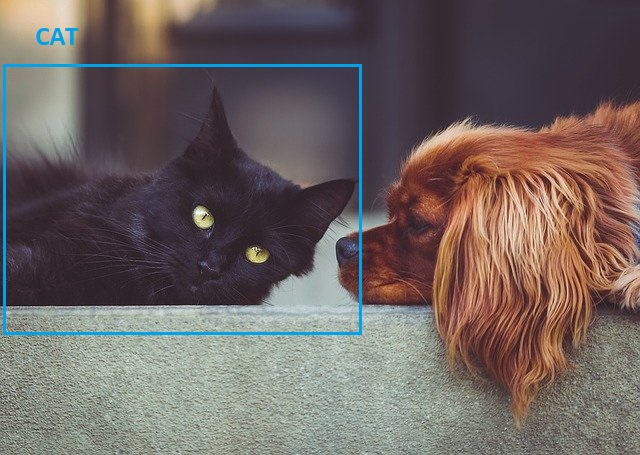
In the figure 1, the blue box around the dog shows the true or ground truth bounding box. And the red box is the predicted bounding box.
Basically, IoU is the overlap (intersection) of the predicted and ground truth boxes divided by the union of the predicted and ground truth boxes.
The following image will help to understand even better.
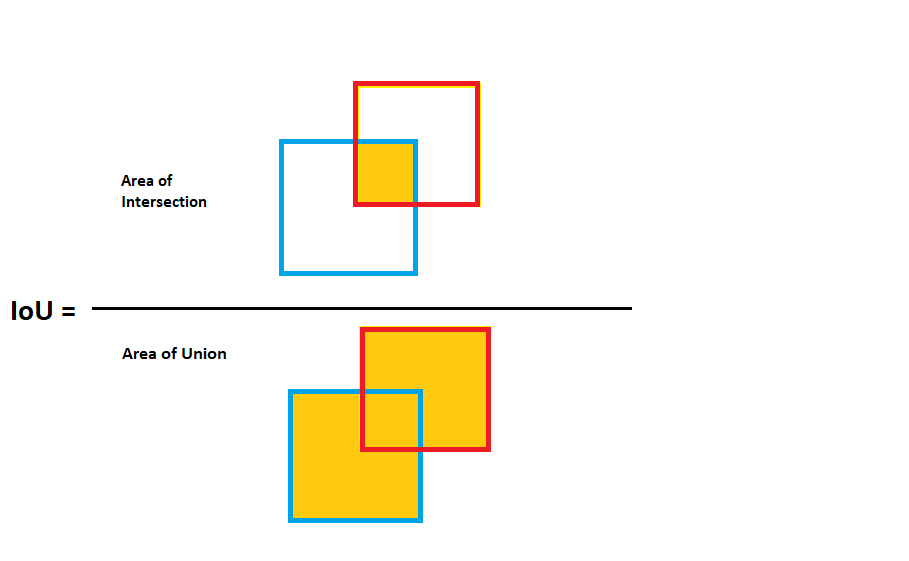
Figure 2 shows how IoU works in case of object detection bounding boxes.
From the above figure, it should be pretty clear about Intersection over Union in object detection and also how important it is.
Determining Results from IoU
The real question is, how do we determine at which IoU value there is an object inside the predicted bounding box? For most datasets and even competitions like MS COCO and PASCAL VOC, an IoU of 0.5 is good enough. This means that if the IoU between the ground truth bounding boxes and the predicted boxes is 0.5, then we conclude that there is an object inside the box. This is know an minimum IoU threshold.
Take the following examples for consideration.
- If IoU >= 0.5 then it is a true positive. This means that there is an object and we have detected it.

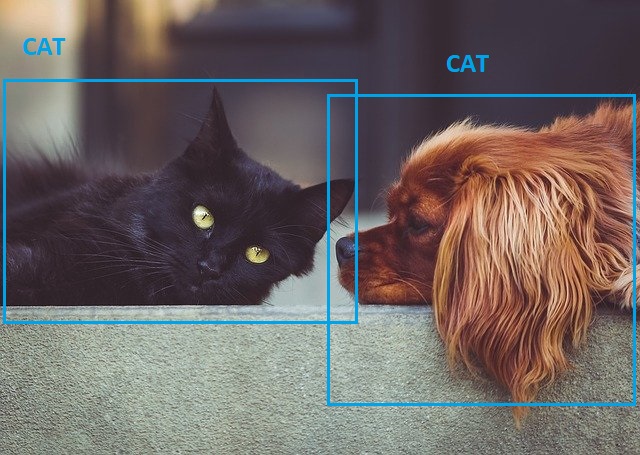
Figure 3 shows that there is a cat and a dog in the image. And the deep learning detection algorithm also correctly classifies the dog and cat and draws bounding boxes around them. This is an example of true positive.
- If IoU < 0.5 then it is a false positive. This means that we are drawing a bounding box around an object but classifying it as another object. Suppose that we are detecting dogs and cats in an image. When the algorithm detects a dog but misclassifies it as a cat, then it is the case false positive.
In the above figure (figure 4) the algorithm detects both the animals. But it detects the dog as a cat. This is a case of false positive.
- Now coming to false negative. This is the case when the algorithm does not detect anything when it should be detecting. For example, there is a dog in the image but the algorithm does not draw any bounding box around it.
In figure 5, we can clearly see that the algorithm does not detect the dog in the image. This is a case of false negative in deep learning object detection.
Now that we have a clear understanding of basic concepts like precision, recall, and Intersection over Union, it is time to move onto the real evaluation metrics in deep learning. First, we will learn about Average Precision (AP) in deep learning based object detection metrics and then we will move onto mean Average Precision (mAP).
Average Precision as Object Detection Evaluation Metrics
The concept of the average precision evaluation metric is mainly related to the PASCAL VOC competitive dataset. Basically, we need to consider any prediction with an IoU of more than or equal to 0.5 as a true positive.
For example, take a look at the following precision and recall values. Do not consider these values to be very accurate. These are just example values that will help you better understand the concept of average precision.
| Precision | Recall |
| 1.0 | 0.2 |
| 1.0 | 0.4 |
| 0.7 | 0.4 |
| 0.6 | 0.4 |
| 0.5 | 0.4 |
| 0.6 | 0.6 |
| 0.67 | 0.8 |
| 0.6 | 0.8 |
| 0.5 | 0.8 |
| 0.6 | 1.0 |
If we plot the precision vs. recall graph for the above values, we will get the following result.
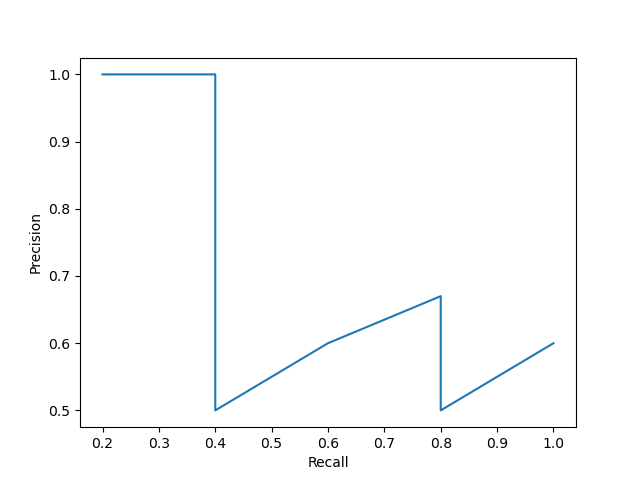
Figure 6 shows the precision vs. recall curve for the values in table 1. To get the Average Precision (AP), we need to find the area under the precision vs. recall curve. But most often, we need to make the lines a bit smoother before calculating the area under the graph.
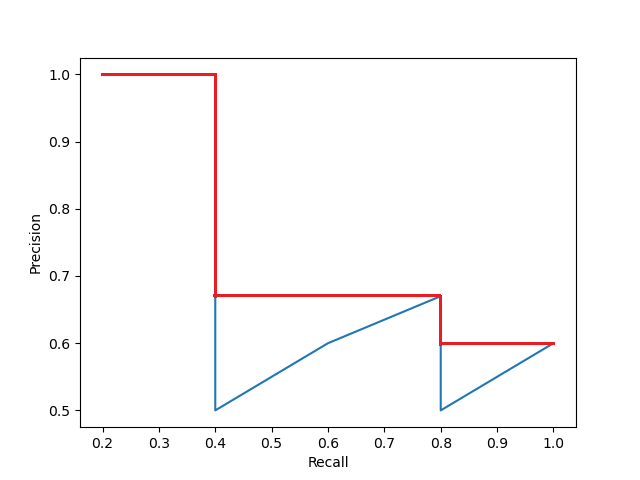
Figure 7 shows how the precision vs. recall curve looks after we smooth it out. So, what are we doing here? Whenever the precision value drops, we are considering the highest precision value to the right to smooth out the curve.
Calculating Average Precision According to PASCAL VOC Challenge
It is always better to understand the object detection evaluation metrics that are standard all over the world. Therefore, we will now move further with the concepts according to the evaluation criteria of PASCAL VOC challenge.
According to The PASCAL Visual Object Classes (VOC) Challenge paper, interpolated average precision (Interpolated AP from here onwards) was used to evaluate both classification and detection.
Now, what is interpolated AP? It is the AP that is defined over a set of equally spaced recall values, from 0.0, 0.1, …, 1.0. We know that the precision and recall values are within the range of 0.0 to 1.0. So, we need to calculate AP for 11 equally spaced values of recall.
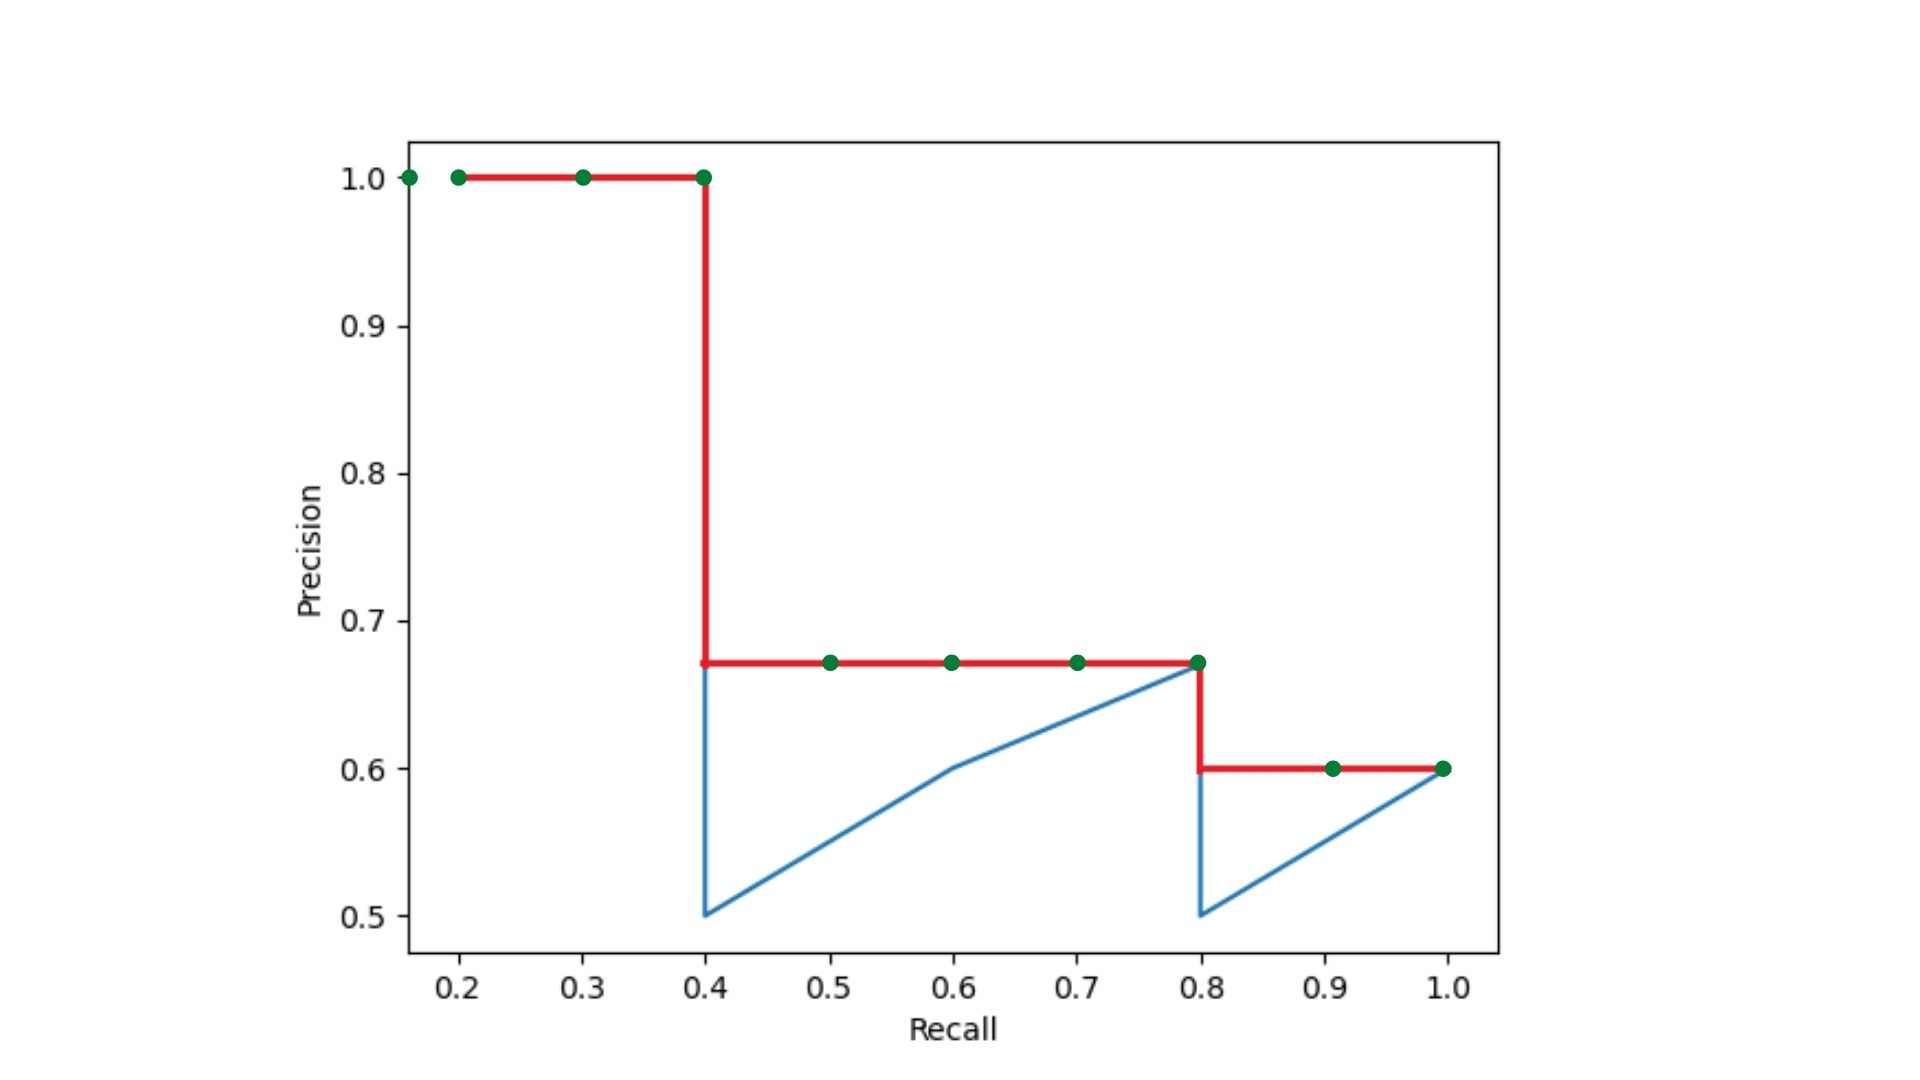
Figure 8 shows the different recall values for calculating interpolated AP in the form of green dots. Although, we can visualize only 10 of 11 recall points due to the nature of the x-axis plot. Still, you do get the idea of how we consider the 11 recall values. Next comes the formula to calculate the AP.
$$
AP = \frac{1}{11}\Sigma_{r\epsilon\{0, 0.1, …, 1.0\}}p_{interp(r)}
$$
And remember when we discussed smoothing out the curve, we took the highest precision value to the right. This is because the precision at each recall level r is interpolated by taking the maximum precision measured for which the corresponding recall exceeds r. The following formula will help you understand.
$$
p_{interp}(r) = max_{\tilde{r}:\tilde{r}\geq{r}}p(\tilde{r})
$$
In the above formula \(p(\tilde{r})\) is the measured precision at recall level \(\tilde{r}\)
Do not worry if the above formula does not come right away to you. You need not write the code for these formulas to create a good deep learning object detection project. There are many helpful tools out there. Still, this a good idea to keep these things in mind. Although there is one question that we may ask. Why do we need an interpolated precision/recall curve to get the proper AP for evaluating our detector?
To answer the question, I am going to quote a small part from the paper.
The intention in interpolating the precision/recall curve in this way is to reduce the impact of the “wiggles” in the precision/recall curve, caused by small variations in the ranking of examples. It should be noted that to obtain a high score, a method must have precision at all levels of recall— this penalises methods which retrieve only a subset of examples with high precision (e.g. side views of cars).
The PASCAL Visual Object Classes (VOC) Challenge
I think that the above words are really helpful in answering the question and makes things quite clear as well. We will conclude our discussion of calculating Average Precision according to the PASCAL VOC competition here. If you want to get more details, you may give the paper a read. I am sure that you will learn much more by going through the paper.
mAP as Object Detection Evaluation Metrics and the MS COCO Dataset
In the recent years, the MS COCO vision dataset has become the standard to evaluate many of the object detection algorithms.
The COCO competition provides the dataset for object detection, keypoint detection, segmentation, and also pose detection. Take a look at their competition page and the paper to get more details.
Let’s discuss the evaluation metric for the MS COCO dataset.
mAP Evaluation Metric
mAP stands for mean Average Precision. Although, COCO describes 12 evaluation metrics for submitting the results and determining the winners for the competition, the main evaluation metric is the mAP or simply called as AP.
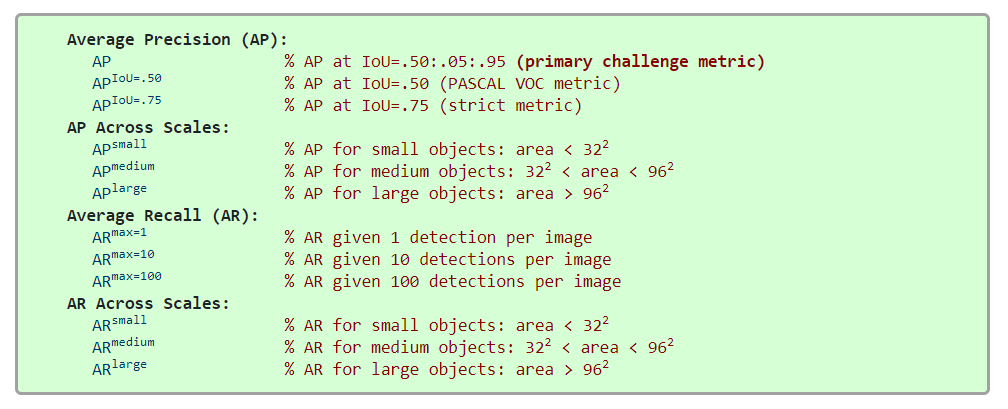
Figure 9 shows all the 12 evaluation metrics that are used to determine the performance of an object detector. Don’t worry looking at all these. We need not go through all of these. We just need to tap into the AP (Average Precision) metric.
For the COCO dataset, to calculate AP, we need to average over multiple IoU values. This is specifically the first point under the AP section in figure 9. That is,
AP % AP at IoU=.50:.05:.95 (primary challenge metric)
So, what does this mean? First of all, we need to have a minimum IoU of 0.5 for the AP calculation to be considered. Okay, then what is IoU=.50:.05:.95. It is pretty simple actually. We start at IoU of 0.50, take incremental steps of 0.05, and stop at an IoU of 0.95. That was not hard, was it? So, we calculate the Average Precision ranging from 0.50 to 0.95.
Now the question is, where is the mAP in all this? To answer that question, we need to take a look at the Metrics section of the COCO evaluation metric page. In that section, on point number 2, you will find the following words,
AP is averaged over all categories. Traditionally, this is called “mean average precision” (mAP). We make no distinction between AP and mAP (and likewise AR and mAR) and assume the difference is clear from context.
COCO Detection Evaluation.
That’s it. Averaging precision over the IoU values is the mAP for the COCO dataset and competition. That makes things a lot clearer now.
Also, quoting point number 3 from the page.
AP (averaged across all 10 IoU thresholds and all 80 categories) will determine the challenge winner. This should be considered the single most important metric when considering performance on COCO.
COCO Detection Evaluation.
As it turns out the average precision over the IoU values is pretty important.
Be sure to take a look at the MS COCO page and evaluation page to get even more information.
A Few Important Points on Object Detection Evaluation Metrics
Many of you may have some questions regarding this article and the points that we covered here. I will try to answer a few.
- Do we need to remember all the formulas while creating a deep learning object detection project?
- Hopefully not. Still, we need to keep in mind what is the best evaluation criteria for the problem that we are trying to solve and act accordingly.
- Is it required to write the code for evaluation criteria from scratch?
- In most cases, the answer is no. There are many resources online where we can find the implementation of mAP, IoU, and AP. But writing your own code for learning and then using it is never a bad idea.
- Will we be covering any object detection projects in future tutorials?
- A lot of them actually. I have plans to post a variety of object detection project. This also includes segmentation in deep learning, which we have not covered yet.
I have also thought about some interesting object detection projects which are interconnected and can be combined into a very large scale project. The only problem is that object detection code examples are huge. And I need a proper way to post those tutorials. Explaining every line of code is not a very good idea, as it will take a lot of interconnected articles and soon become difficult to track. Please provide your ideas in the comment section about how we can organize deep learning object detection articles. The thing is that I don’t only want to post deep learning inferencing articles on pre-trained datasets. I also want to teach you how we can train our own SSD, YOLO, and many more object detectors on custom datasets. I hope that we will figure out a way.
Summary and Conclusion
In this article, you learned about the different evaluation metrics in the field of object detection and deep learning. You got to know about IoU, AP, and mAP evaluation metrics and how each of them is used in different real-life competitions.
If you have any doubts, thoughts, or suggestions, then please leave them in the comment section. I will surely address them. If you find that any concept is wrong or can have a better explanation, then you are very much welcome to suggest your ideas.
You can contact me using the Contact section. You can also find me on LinkedIn, and X.

A best blog we ever read like this ….
May u have many more….
thankx
Thank you so much.