
In this post, we will explore the YOLOP model for Panoptic Driving Perception.
Real-time inference is a big deal in the deep learning world for deploying any computer vision application. Even more so when we are dealing with critical applications like self-driving cars. The models that carry out end-to-end vision perception for self-driving in real-time are difficult to build. Studying such models can give us some fascinating insights. Although there are not many such open-source models out there, YOLOP is one of them.
In this post, we will get into the details of YOLOP which can handle traffic detection, drivable area segmentation, and lane detection in real-time.
Let’s check out what we will cover in this post.
- We will start with a very brief introduction to the YOLOP model.
- Then we move to the YOLOP paper. Here we will:
- Discuss the contributions of the paper.
- The YOLOP model architecture.
- The loss function.
- The training experiments.
- Results.
If you are interested, check out the posts on HybridNets. This is another end-to-end vision perception system for autonomous driving.
- Introduction to HybridNets using PyTorch
- HybridNets – Paper Explanation
- Running Inference using HybridNets End-to-End Network
We will try to cover as many details as possible of the YOLOP model here.
What is the YOLOP Model?
YOLOP is a Panoptic vision perception system to aid autonomous driving in real-time. It was published by Dong Wu, Manwen Liao, Weitian Zhang, Xinggang Wang, Xiang Bai, Wenqing Cheng, and Wenyu Liu in March 2022. This is one of the very first end-to-end panoptic vision perception models aimed at self-driving systems running in real time.
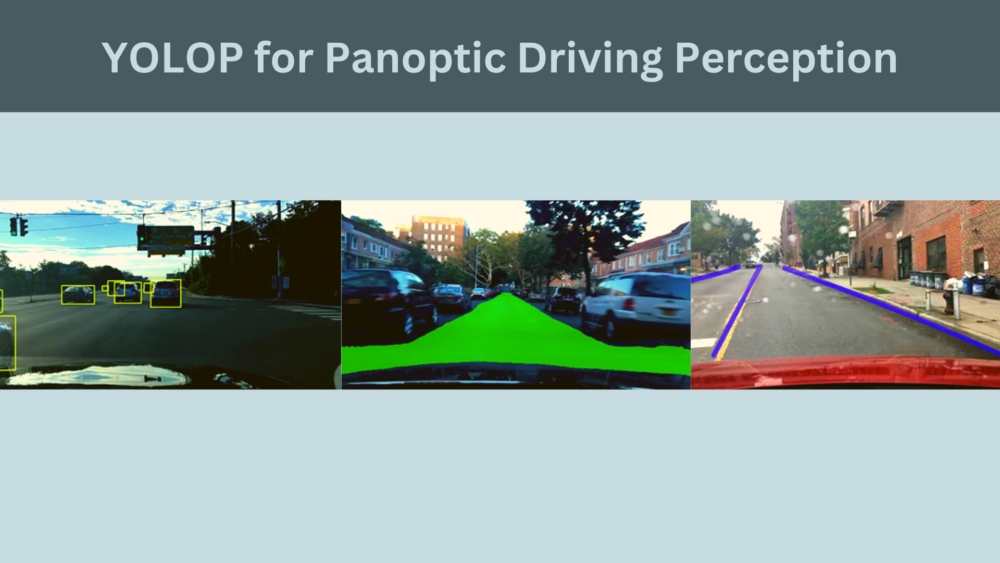
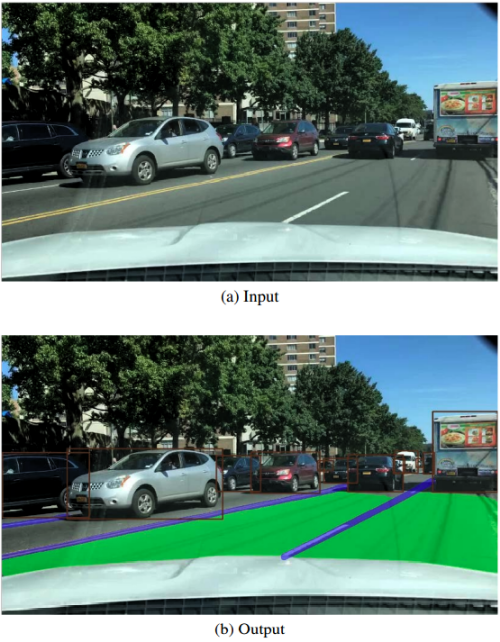
It performs traffic object detection, drivable area segmentation, and lane detection simultaneously. The following is an example image from the paper.
This model runs in real-time while providing high precision on all three tasks. And it is one of the few open-source models out there which does this.
The model is made up of one encoder and three different decoders. Each decoder has its own specific task. And the model has been trained on the largest available open-source driving dataset, BDD100K.
As the model takes a comprehensive view of the scene to perform all three tasks, that’s why the name YOLOP (Panoptic).
We will discuss all the details about the architecture, approach, and training experiments, in the further sections.
Contributions of the Authors
The main motivation was to build a multi-task network for panoptic driving perception. With the achieved results, there are three major contributions of the paper:
- The model can handle three tasks, traffic object detection, drivable area segmentation, and lane segmentation simultaneously. That too in real-time during inference.
- Rather than learning the three tasks with alternating optimization, the network learns them simultaneously.
- The ablation studies show that the grid-based mechanism of the detection task is more related to that of semantic segmentation.
Further on we will discuss the network details as proposed by the authors of the paper.
YOLOP Model Architecture
As with any other object detection and semantic segmentation model, YOLOP too is based on an encoder-decoder architecture. In fact, YOLOv4 is the inspiration behind the architecture of YOLOP for the most part.
The model trains end-to-end without sharing any redundant blocks with each of the decoder heads.
The YOLOP Encoder
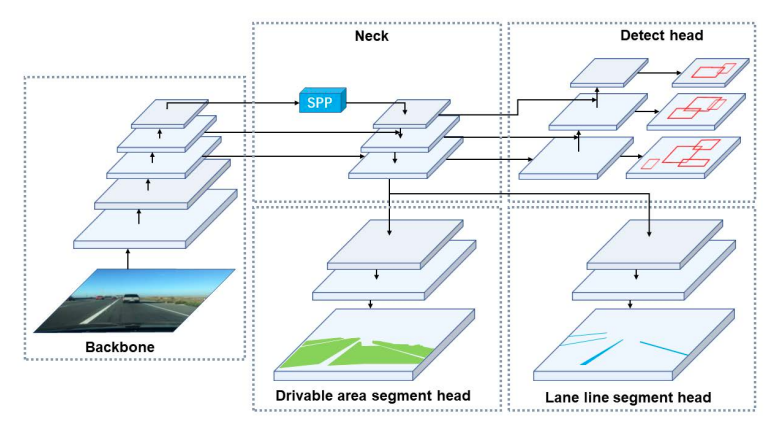
As it is pretty clear from figure 3, the YOLOP encoder consists of the backbone and the neck.
The authors choose the CSP Darknet as the backbone for YOLOP. This is the same backbone that is used in YOLOv4. The CSP Darknet is also capable of giving a real-time performance. So, it is a good choice for a multi-task network where we already have the overhead of three different decoder heads.
The neck is just as important as the backbone. It is used to fuse the features that are generated by the backbone. The neck consists of SPP (Spatial Pyramid Pooling) and FPN (Feature Pyramid Network)
SPP, as the name suggests, helps to generate and fuse features as different scales of feature maps. And FPN fuses the features at different semantic levels. Both of these combined, help to learn features at different scales and semantic levels. This immensely helps the decoder heads to get better feature information from the previous layers.
YOLOP Detection Head Decoder
For the three tasks, YOLOP has three different decoder heads. The first one is the detection head.
YOLOP uses the anchor-based method just as in YOLOv4. But before the detections happen at different scales, we have a PAN (Path Aggregation Network) which does a bottom-up feature fusion.
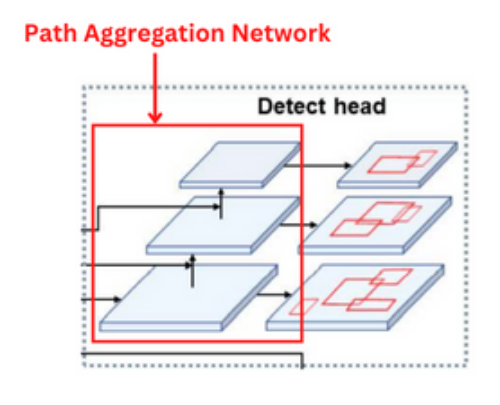
The above figure shows the PAN before the detection layers in the YOLOP network. You may also observe that YOLOP concatenates the features from the FPN with the features maps of the PAN. This immensely helps to capture multi-scale feature maps using which the detection layers can get a rich set of features for detection.
There are three priors with different aspect ratios for detection on each multi-scale feature map. The detection head detects the offset positions of boxes along with the scaling of height and width. It also predicts the probability of each category and the confidence of the prediction. This part remains the same as was in YOLOv4.
YOLOP Segmentation Head for Drivable Area Segmentation & Lane Line Segmentation
The segmentation heads for the two tasks are different. But taking a closer look at figure 3 reveals that they accept the features from the same FPN neck and follow the same architecture as well. Not only that, the authors lay out a few specific points regarding the size of the feature maps in the segmentation layers.
- The feature map that YOLOP feeds to the segmentation head from the final FPN layer has size (W/8, H/8, 256). Here, W and H are the original width and height of the image, and 256 is the number of channels in the feature map.
- YOLOP outputs the final segmentation maps after three upsampling layers. The size for this output is (W, H, 2). There are just 2 channels in each feature map as each pixel represents whether it belongs to an object class or the background.
Other than that, the authors do not add SPP to the segmentation branches as it does not show any improvement. Also, they do not use deconvolution in the upsampling layers. Instead, they opt for Nearest Neighbour Interpolation which reduces the computation. This results in faster inference.
The Loss Function
There are three parts to the loss function in the YOLOP network. One loss function for each of the three tasks, one detection head, and two segmentation heads.
The detection loss is a weighted sum of the bounding box regression loss, the object loss, and the classification loss.
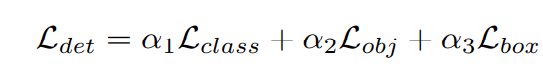
\(\mathcal L_{class}\) is the classification loss and \(\mathcal L_{obj}\) is the confidence prediction loss. Both are focal losses that focus more on the hard examples. \(\mathcal L_{box}\) utilizes the CIoU loss. This considers the distance, overlap rate, the similarity of scale, and the aspect ratio between the predicted box and the ground truth box. The alphas are the weight values to gain a weighted sum of each individual loss part.
The loss for the drivable area (\(\mathcal L_{da-seg}\)) and lane line detection (\(\mathcal L_{ll-seg}\)), both contain the Cross-Entropy loss.
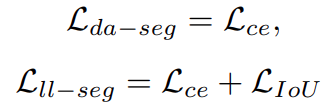
The final loss function is the weighted sum of the three loss parts.

Here, the gammas are the weight values used to tune the final loss.
Training Experiments
The YOLOP model has been trained entirely on the BDD100K dataset. The dataset contains 70000 training images, 10000 validation images, and 20000 test images. But all the benchmark results in the paper are from the validation set as the test set labels are not public.
Implementation Details
The following table contains details about the training paradigm and the data augmentation.
| Prior anchors | Using k-means clustering |
| Optimizer (learning rate, Beta1, Beta2) | Adam (0.001, 0.937, 0.999) |
| Learning rate adjustment and scheduling | Warm-up and cosine-annealing |
| Data augmentations | Adjusting hue & saturation, random rotation, scaling, translation, shearing, left-right flipping |
During training, the authors resize all images from 1280×720×3 to 640×384×3. All training experiments were run on an NVIDIA GTX TITAN XP.
YOLOP Results
Here, we will focus on the results as provided in the paper.
Traffic Object Detection and Drivable Area Segmentation Results
For the detection results, the authors use mAP50 as the evaluation metric, that is, mAP at 0.50 IoU. As many detection models are trained on the COCO dataset, the authors had to retrain some of the models on the BDD100K dataset. For most of the popular detection models, only the traffic object detection results are compared.
The following are two tables from the paper.
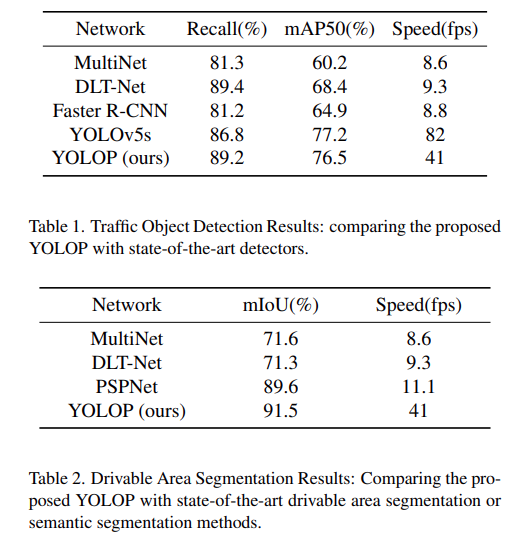
For traffic object detection, the YOLOv5s model seems to surpass YOLOP in both mAP and FPS. But as the authors point out, YOLOv5s is faster as it does not contain extra segmentation heads. For the drivable area segmentation, YOLOP easily beats all other models, both in mIoU and FPS.
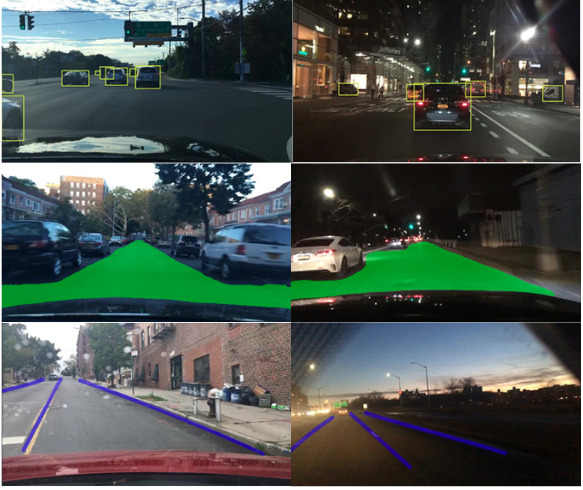
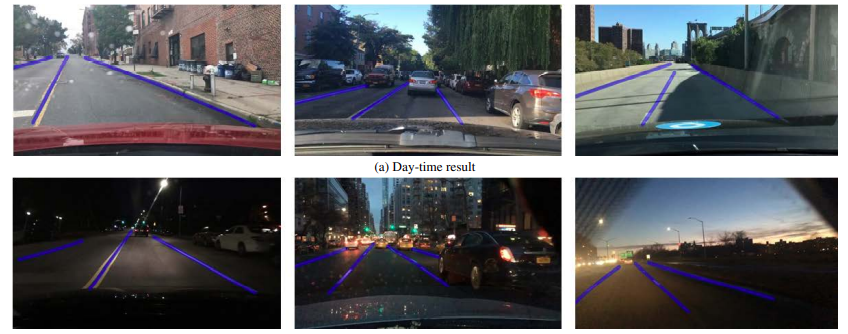
The following are some images showing results from day-time and night-time inferences using YOLOP.
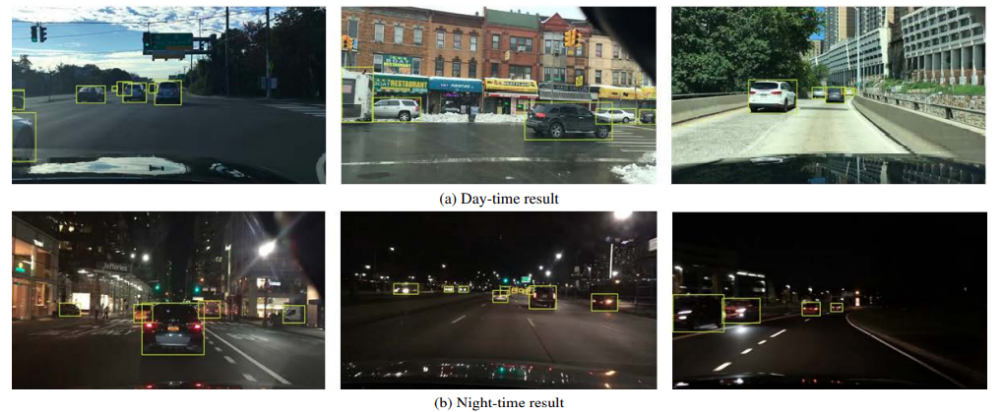
The model is performing quite well even at night-time.
Now, a comparison between Faster RCNN and YOLOP.
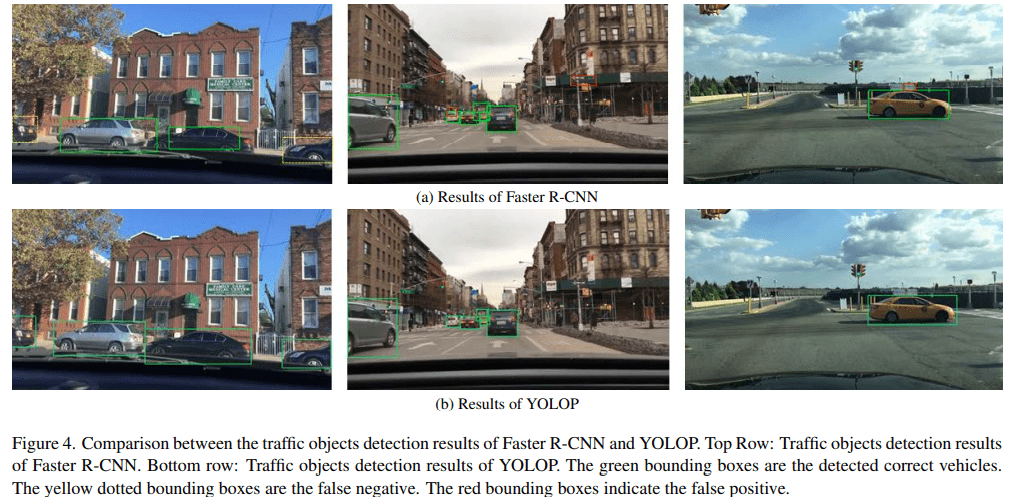
We can see that Faster RCNN is missing some of the cars (dotted yellow lines) and wrongly predicting some of them as well (red boxes). Whereas, YOLOP does not seem to make such mistakes.
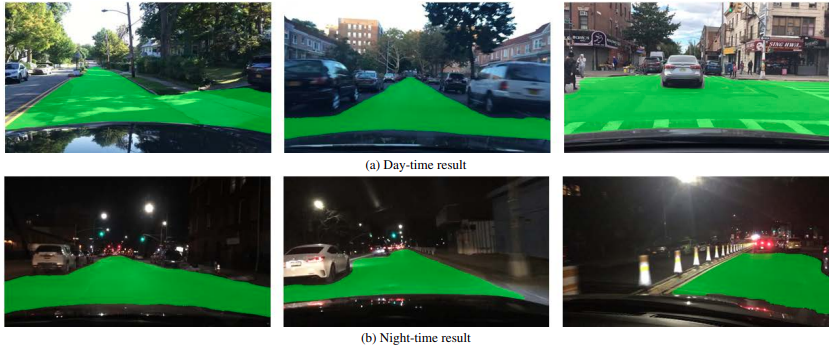
For drivable area segmentation also, YOLOP seems to perform quite well during night-time.
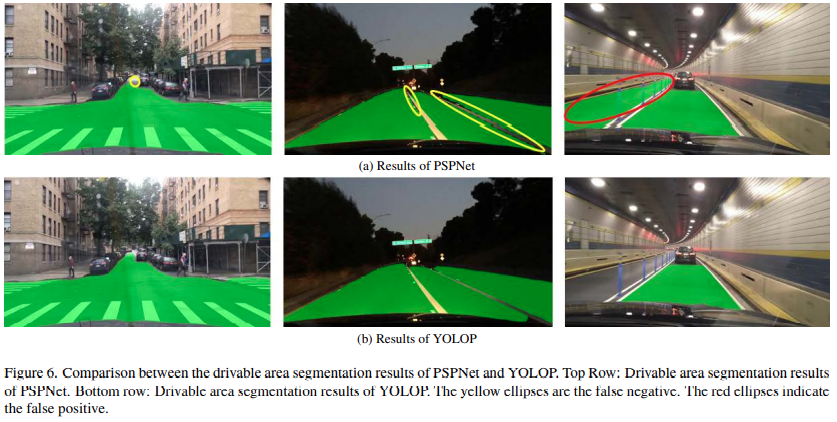
In comparison to PSPNet, the results of drivable area segmentation look more refined using YOLOP.
Lane Line Detection Results
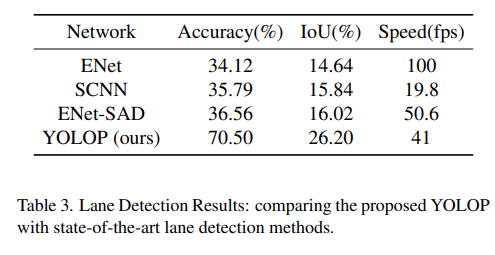
In lane line detection also, YOLOP surpasses all other models compared with.
And the following are some qualitative image results.
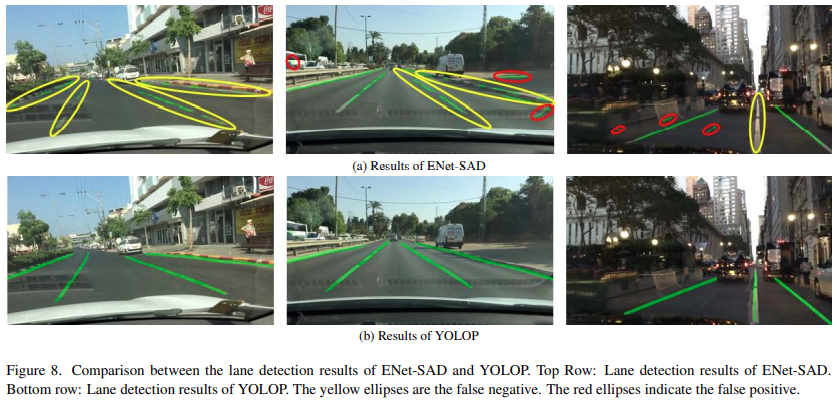
In figure 15 we can clearly see that ENet-SAD is making wrong predictions and also missing out on lane line detection compared to YOLOP.
There are other details in the paper where the authors perform ablation studies and compare the multi-task training vs independent training of the three heads. These sections are worth going through if you wish to gain a deeper understanding of the YOLOP model.
Summary and Conclusion
In this blog post, we explore the YOLOP model for panoptic vision perception. We explored how efficient YOLOP is in traffic object detection, drivable area segmentation, and lane line detection. It surpasses most of the other models in speed and accuracy in these tasks. Hopefully, this post was helpful for you.
If you have any doubts, thoughts, or suggestions, please leave them in the comment section. They will surely be addressed.
You can contact me using the Contact section. You can also find me on LinkedIn, and X.

2 thoughts on “YOLOP for Panoptic Driving Perception”