

In this article, we will take a practical approach to the k-Nearest Neighbor in machine learning. For implementation purposes of the k-Nearest Neighbor, we will use the Scikit-Learn library.
We will try a classification problem using KNN. We will try the digit classification using the MNIST dataset. After all, before neural networks, traditional machine learning algorithms were used (and still being used widely). In my previous article, we discussed the effect of the number of neighbors, K, and the algorithms on the time and accuracy of KNN. So, we will try to implement those within code in this article.
What will we cover?
- How different numbers of neighbors (K) affect the KNN accuracy?
- Fit a KNN classifier and check the accuracy score for different values of K.
- Visualize the effect of K on accuracy using graphical plots.
Get the dataset
First, you need to download the digit MNIST dataset. You can download the dataset from here. The dataset contains a train set and a test set. The train set has 60000 instances with labels and pixel values as the features. And the test set has 10000 instances.
Now, you are all set to follow along with the code.
Load the Data and Prepare the Train and Test Set
In this section, we will load the data and prepare the train and test set. The dataset is in Pandas Dataframe format and I believe that many of you must have done this procedure many times before.
First of all, we need to import some libraries that we will need further along.
import numpy as np
import pandas as pd
import matplotlib.pyplot as plt

from sklearn.neighbors import KNeighborsClassifier
from sklearn.metrics import accuracy_score

# for reproducibility
np.random.seed(42)
We have also used a random seed generator for the reproducibility of results.
Now, let’s read the data from the disk.
train_df = pd.read_csv('mnist_train.csv')
test_df = pd.read_csv('mnist_test.csv')
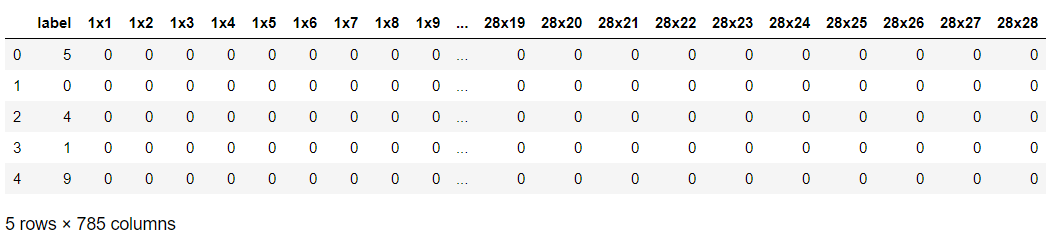
Next, we will prepare the training and testing set. For that, we will need to separate the labels and pixel values from both, the training set and the testing set. After that, we will normalize the dataset as well.
y_train = train_df['label']
x_train = train_df.drop(labels=['label'], axis=1)

y_test = test_df['label']
x_test = test_df.drop(labels=['label'], axis=1)

# normalize
x_train = x_train / 255.0
x_test = x_test / 255.0

# convert to n-dimensional array
x_train = x_train.values
x_test = x_test.values
In the last two lines of the above code snippet, we have also converted the dataset from data frames to n-dimensional arrays and we will be working with that further on.
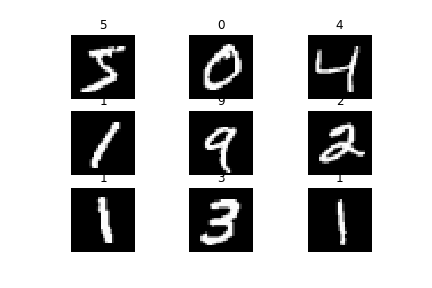
Before moving on to the training phase, we can visualize some of the images in our data. Let’s do that first and then move to the training of the data using k-Nearest Neighbor.
# visualize
plt.figure
for i in range(9):
    plt.subplot(3, 3, i+1)
    plt.imshow(x_train[i].reshape(28, 28), cmap='gray')
    plt.title(y_train[i])
    plt.axis('off')
    plt.savefig('mnist_plot.png')
plt.show()
Training a KNN Classifier with Default K Value
In this section, we will train a KNN classifier using the Scikit-Learn library. We will not change any of the hyperparameters and will use the default K value.
The K value in Scikit-Learn corresponds to the n_neighbors parameter. By default the value of n_neighbors will be 5.
knn_clf = KNeighborsClassifier()

knn_clf.fit(x_train, y_train)
In the above block of code, we have defined our KNN classifier and fit our data into the classifier.
The fitting of data will only take a few seconds as there is no learning taking place here. The next step, that is testing our classifier on new data points will take more time.
Let’s predict our classes on the x_test dataset. In the next block, we will test our classifier on the test set. We will check the accuracy of the classifier also, when n_neighbors is 5.
preds = knn_clf.predict(x_test)

accuracy = accuracy_score(y_test, preds)
print(accuracy)
0.9688
In this case, the accuracy of 96.8 %. Not too bad considering the fact that we have not done any hyperparameter changes.
Training with 20 Ks
Now we will test our classifier by using 20 different values of K. That means, the n_neighbors parameter will range from 1 to 20.
Now, the question is how are we going to do it. We will simply put our KNN classifier inside a for loop and keep changing the value of n_neighbors. After each iteration, we will append the accuracy_score into a list.
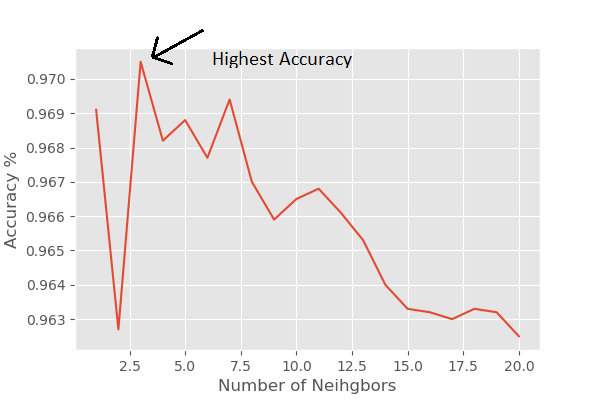
Finally, we will plot the accuracies vs. n_neighbors graph and see the effect of n_neighbors on our classifier.
acc_list = []

# testing knn classifier with 20 k values
for i in range(1, 21):
    knn_clf = KNeighborsClassifier(n_neighbors=i)

    knn_clf.fit(x_train, y_train)

    preds = knn_clf.predict(x_test)

    accuracy = accuracy_score(y_test, preds)

    acc_list.append(accuracy)
In the above code block, first, we have defined a list (acc_list) that will hold all the accuracy values after each iteration.
Next, a for loop is looping over 20 values from 1 to 20. In each iteration, we are providing the value of n_neighbors as i which is the current iterator value. Then, we are predicting and finding out the accuracy_score for that particular iteration. Finally, we are appending the accuracy value to the acc_list.
We can now plot our Accuracy vs. n_neighbors graph and see the effect of the number of neighbors on the accuracy of our classifier.
In the next block of code, we will write the code for plotting the graph.
num_k = np.arange(1, 21)
plt.figure(dpi=100)
plt.style.use('ggplot')
plt.plot(num_k, acc_list)
plt.xlabel('Number of Neihgbors')
plt.ylabel('Accuracy %')
plt.savefig('acc_plot.png')
Observation
From the graph, you can see that we have the highest accuracy with n_neighbors = 3. After that, the accuracy keeps on decreasing, although not smoothly. So, for this problem, the default value of 5 was not optimal. We found that K = 3 was the optimal value.
How can we further make our classifier better?
Along with varying values of K in a loop, we can also find the k-fold cross-validation result. This is will give us an even more detailed analysis of our classifier.
Summary and Conclusion
In this article, you got to know how to apply k-Nearest Neighbor in machine learning through coding. I hope that you enjoyed the article and learned from it as well. Consider subscribing to the website for more timely content.
If you have any questions, ask them in the comment section and I will surely try to address them. You can also find me on LinkedIn, and Twitter.

I tried running this in kaggle. I got an error here
plt.imshow(x_train[i].reshape(28, 28), cmap=’gray’)
It says KeyError: 0
Hello Sheila. Can you please check that you are loading the data in the Kaggle Kernel properly?